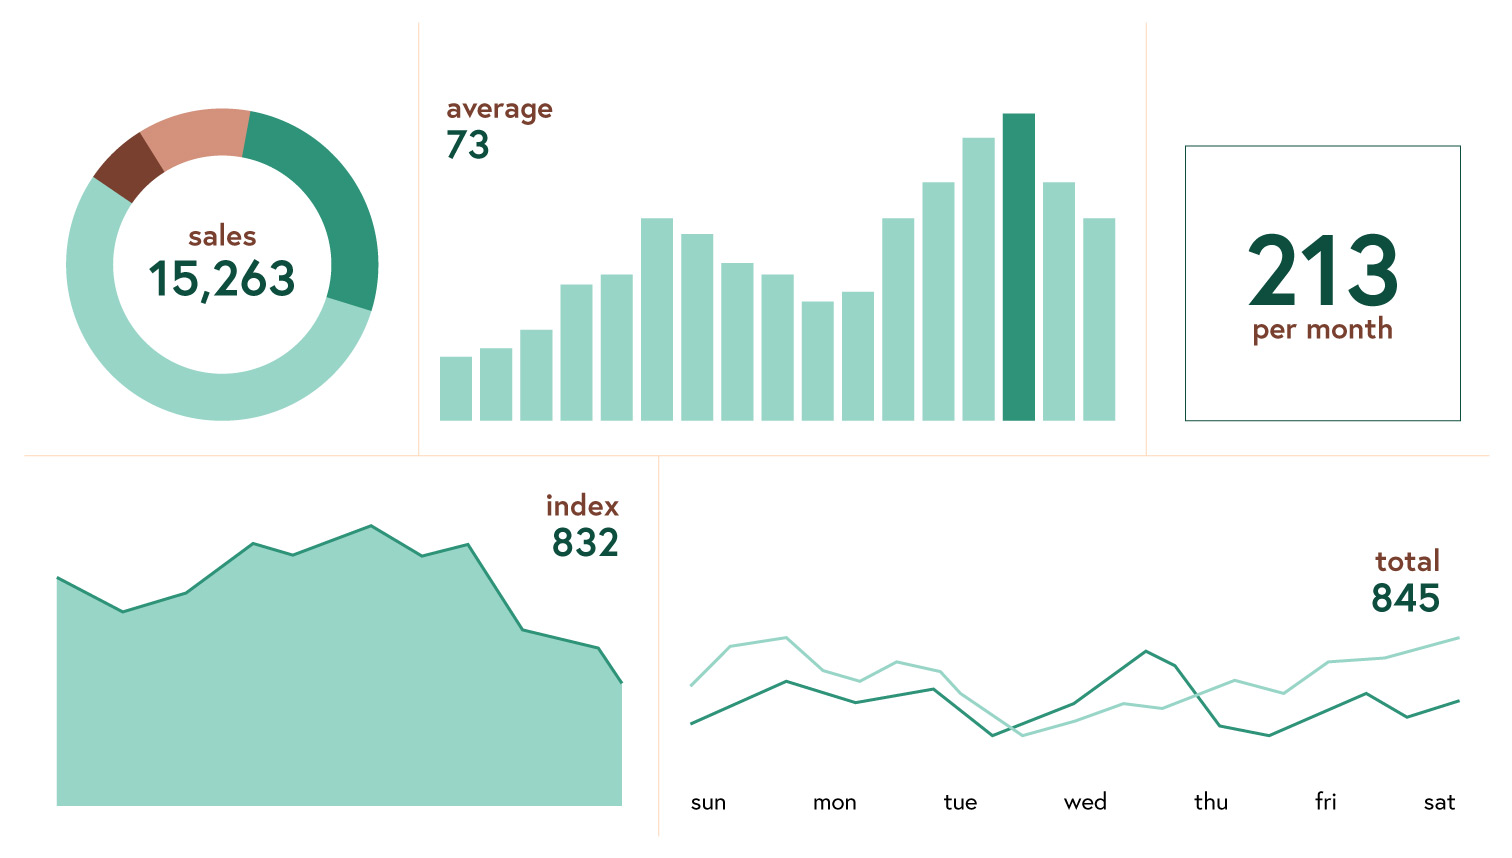
Data Dashboards
Data Dashboards are often both visually pleasing and provide a way to tie together different data points. Done correctly, data dashboards can deliver compelling arguments. At the most basic sense, data dashboards are simply several individual data visualizations displayed on a screen at the same time. The point of a data dashboard is not to just combine visualizations, but to reveal possible relationships between various data points or put them into context as a whole.

From Simple Combinations to Dynamic & Interactive
To make a data dashboard the essential requirement is to include several different key performance indicators (KPI) that together provide insights. The data dashboard can also be complex for example by providing controls for the user to modify the variables and measures to learn even more from the data. Data dashboard have become popular, especially as the field of data and business analytics has grown in prominence.
The visual aspect of data dashboards is important. Having an eye-pleasing display of the data can enhance the impact of the data visualizations. Obviously, the colors and color-combinations go a long way to make the data dashboard more interesting for the user. A consistent design for the data visualizations also is important to emphasize the connection between the different data visualizations. Mixing in text is also important and provides context and a textual aspect of the KPIs.
