Introduction
In the Spring of 2022, I am teaching students about data visualization. In an effort to help students with the learning process, I came up with the concept of a website that would provide opportunities to learn and test their knowledge about data visualization. The result of this work was the Data Viz Portal. This website has the goal of helping students discover and learn about data visualization on an attractive and interactive space.
The Challenge
Students enrolled in the class called Introduction to Data Visualization can find it difficult to wade through all the information that is available to them about understanding and building data visualizations. They can feel overwhelmed if there’s either too much information or it’s not organized in a way that is easy to understand. Students also need to test their learning, which is an important part of the learning process.
The Solution
The solution to this challenge is a website that combines resources with a place for students to take quizzes to test their knowledge. The resulting website would be a single location to address multiple student needs. Students can visit the website to access links to useful resources, view videos about Data Visualization, see examples of data visualizations, and take quizzes to test their knowledge. The website is also fully responsive, allowing students to view the website on a mobile device and access information from their preferred study space or when they are on the go. The website also provides students with a user account so they can track their progress taking the quizzes.
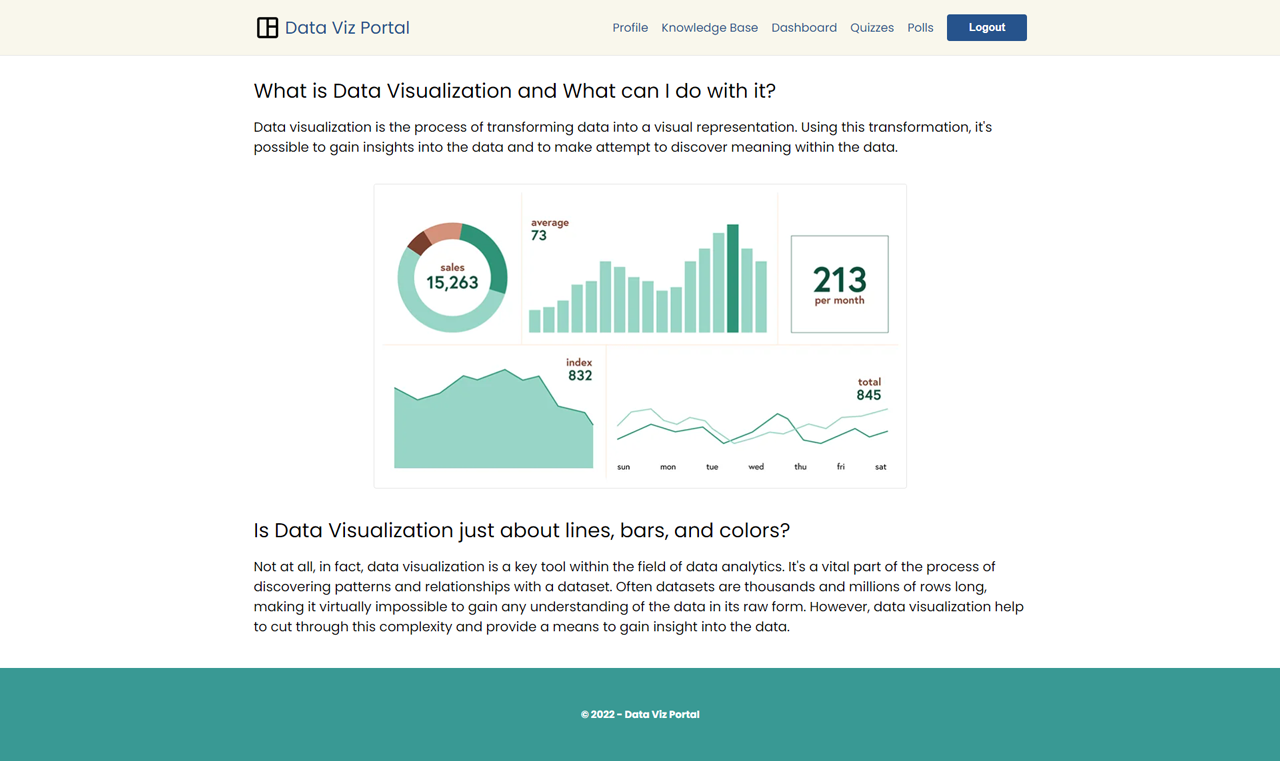
Data Viz Portal - Project Website Homepage
Technologies Used
The project made use of React for development of the user interface and incorporated supporting technologies such as React Router and React Google Charts. Data was stored in a Firestore database, which makes use of the Firebase service and SDK. The website also takes advantage of the Firebase authentication and hosting services. The development of the project website made use of Sass to organize and automate the styling for the website.
UX Design
The design for the website focused on simplicity of layout and clarity of the content. To this end, the website only included a header, a footer, and a main content area. The design focus was placed more on content and usability. Forms used for the signup, login, quiz, and polls emphasized a clean layout and attractive UI elements. Other aspects of the design included the color palette and the typography. The color palette aimed to be modern and have a futuristic feel. The typography used only one font - Poppins from Google Fonts - for headings and body text with the aim of creating a modern feel and maximizing readability.
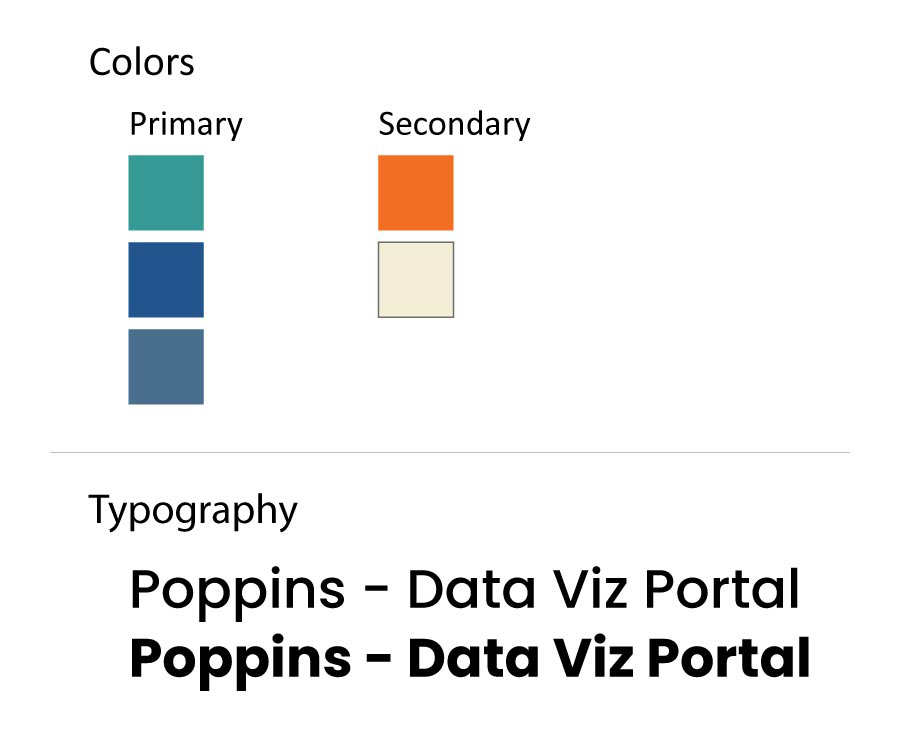
Data Viz Portal - Design Options
The design also accounted for use on multiple screen sizes and orientations. The website design is optimized for both desktop and mobile usage. Elements such as the layout and text sizing will adjust depending on the device and screen sizing. This guarantees a good user experience no matter how a user chooses to access the website.
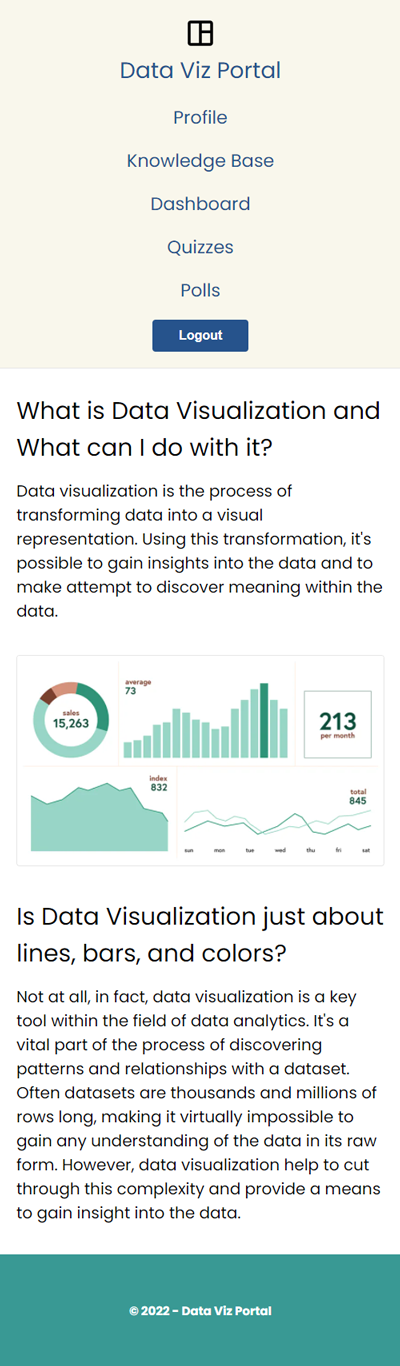
Data Viz Portal - Project Website Mobile Homepage
The website logo is also designed with minimalism in mind. The logo adopts a Google Font icon for a data dashboard. It’s use is meant to imply simplicity and the arrangement of data within a dashboard space.
Information Architecture
The website’s information architecture has several top-level pages and a small number of nested page sections. At the top level are the home page, the knowledge-base page, the login, and the signup pages. Each of these pages is accessible without needing to be logged into the website. Once a user has logged in they will have access to a profile and dashboard page, which displays personalized information. They also can view and take quizzes and polls, which are sub-sections to the quiz and poll pages.
The knowledge-base page contains information that is sub-divided into four separate tab views. Users are able to select a different tab and load the content for that tab within the page. The knowledge-base page contains a range of different content including embedded videos and a data visualization from Tableau Public.
Content Development
The content for the website consists of educational-focused information. On the website, students and visitors can learn about data visualization and how to use software like Tableau to create them. Users can gain access to many different external resources as well. The website also aims to help students test their knowledge of data visualization through quizzes. Finally, students fill out poll questions each week, which are then visualized, along their their quiz results, on the dashboard page.
Development
This project presented multiple challenges including integrating new versions of existing technologies, such as Firebase and React Router. The project also accessed user data and created personalized visualizations for each user making use of the React Google Charts library. Finally, the entire project was created using React and incorporated the latest features of React such as hooks and context.
Firebase
One of the first steps taken was to prepare Firebase for use in the project. For this project, it was possible to integrate Firebase Web v9 into the project, which offered several improvements over the previous v8. The main selling point of Firebase Web v9 is it’s modular approach to development and use of functions to execute different features of available services. This introduces a large degree of flexibility into the development process and results in smaller bundled code into production. For this project, the services used included Firebase Authentication and the Cloud Firestore, a NoSQL database.
The modular approach in Firebase Web v9 helped to streamline the process of adding and consuming services from Firebase. For example, the login process made use of the Firebase Auth service and required two functions, first the getAuth() function to retrieve the FirebaseAuth object for the project, and then the signInWithEmailAndPassword() function to sign in the user. The simplified code for the useLogin custom hooks below demonstrates this process.
import { getAuth, signInWithEmailAndPassword } from 'firebase/auth';

export const useLogin = () => {
  const auth = getAuth();

  const login = async (email, password) => {
    try {
      await signInWithEmailAndPassword(auth, email, password);
    } catch (err) {
      if (!isCancelled) {
        // set an error message
      }
    }
  };

  return { login };
};
Firebase Firestore works similarly to the Authentication process. To work with Firestore, it’s necessary to first import the functions needed to connect to the Firestore service and perform queries on it. This process is initialized with the getFirestore() function, then to use the various functions available to perform different queries, such as doc() and getDoc(), shown below. This process highlights the strengths of the v9 Firebase Web SDK, which only requires importing the specific functions needed instead of an entire SDK.
import { getFirestore, doc, getDoc } from 'firebase/firestore';

const db = getFirestore();

const loadProfile = useCallback(
  async (docId) => {
    const docRef = doc(db, 'users', docId);
    try {
      const docSnap = await getDoc(docRef);
      const docData = docSnap.data();
      // do something with the document data
    } catch (error) {
      // set an error message
    }
  },
  [dispatch]
);
React Router
Another important part of the project was React Router, which had also recently been updated to version 6. This version introduced some important changes to the components used to creating routes and their features. First, there is a new <Routes> component, which replaced the function of the <Switch> component. The Routes component also simplified the process of selecting the preferred route, based on the best match instead of being processed from route order from top to bottom. React Router also supports route nesting, allowing sub-routes to be accepted as children of a parent Route. This results in a more logical structure for the routes in a single location.
import { BrowserRouter as Router, Routes, Route } from 'react-router-dom';

return (
  <div className='app'>
    <Router>
      <Routes>
        <Route path='/' element={<Home />} />
        <Route path='/profile' element={<Profile />} />
        <Route path='/knowledge-base' element={<KnowledgeBase />} />
        <Route path='/poll' element={<Poll />}>
          <Route path=':weekNumber' element={<Poll />} />
        </Route>
        <Route path='/quiz' element={<Quiz />}>
          <Route path=':weekNumber' element={<Quiz />} />
        </Route>
      </Routes>
    </Router>
  </div>
);
Version 6 of React Router also introduces several useful hooks that offer programmatic functionality. These hooks include existing features like useParams as well as new hooks like useNavigate. This hook can be used to navigate the user based on the result of logical operations. For example, within a React element, the following code could be added to navigate the user to an index page if there is no user object.
import { useNavigate } from 'react-router-dom';

const navigate = useNavigate();

useEffect(() => {
  if (!user) {
    navigate('/');
  }
}, [user, navigate]);
These new features make using React Router more intuitive (for example, with the simplified Route matching) and functional (with the expanded hooks).
Adding Data Visualizations with React Google Charts
A key element of the website is to help student learn more about data visualization. One way to do this is to transform some user data into a visualization they can view within the website. To do this, I accessed the quiz results from the user and passed the data to a chart type component from React Google Charts. The example below shows a Column Chart component.
import { Chart } from 'react-google-charts';
import { Spinner } from './Spinner';

export const ColumnChart = ({
  title,
  hAxisTitle,
  vAxisTitle,
  chartData,
  loading,
  error,
}) => {
  const options = {
    hAxis: {
      title: hAxisTitle,
    },
    vAxis: {
      title: vAxisTitle,
      maxValue: 10,
      minValue: 0,
      ticks: [1, 2, 3, 4, 5, 6, 7, 8, 9, 10],
    },
    legend: { position: 'bottom' },
  };

  if (loading) {
    return (
      <div className='centered'>
        <Spinner />
      </div>
    );
  }

  if (error) {
    return (
      <div className='centered'>
        <p>No Data to Display</p>
      </div>
    );
  }

  return (
    <div className='chart'>
      <h3>{title}</h3>
      <Chart
        chartType='ColumnChart'
        width='100%'
        height='400px'
        data={chartData}
        options={options}
      />
    </div>
  );
};
Building a chart with React Google Charts is fairly easy. Once the Chart component is imported from the react-google-charts library, it’s possible to pass in options and data to the component props, which are accessed to build the visualizations.
Conclusion
This project was challenging in many ways. The website requires users to create accounts and login to the website to perform functions like taking polls and quizzes. It’s necessary to track the user and write to the Firestore database data that is logically linked to the user. The website also requires retrieval and processing of data to display as desired in various data visualizations used in the website. React offered a good solution to these problems and allowed the website to be both functional and performant at the same time.